This document outlines the new features that are being pushed on to CloudSupervisor Azure Prod environment. Customers will be able to leverage these new features by taking this document as a guideline.
-
INTRODUCTION
This document outlines the new features that have been added to the CloudSupervisor tool in January 2023.Customers can use this document to leverage the benefits of these newly added features.
This document is intended for company personnel, customers, and partners - they may use it as a reference to understand the feature updates and utilize them accordingly.
-
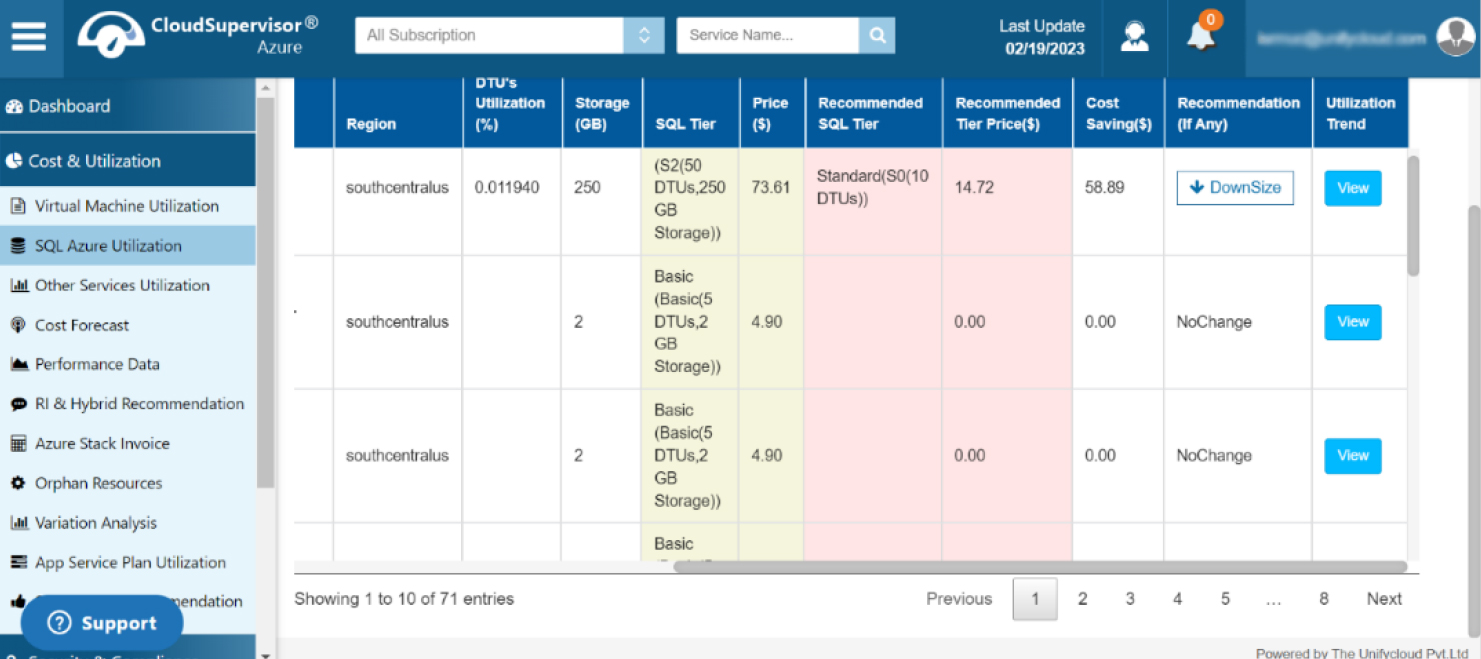
Cost & Utilization
-
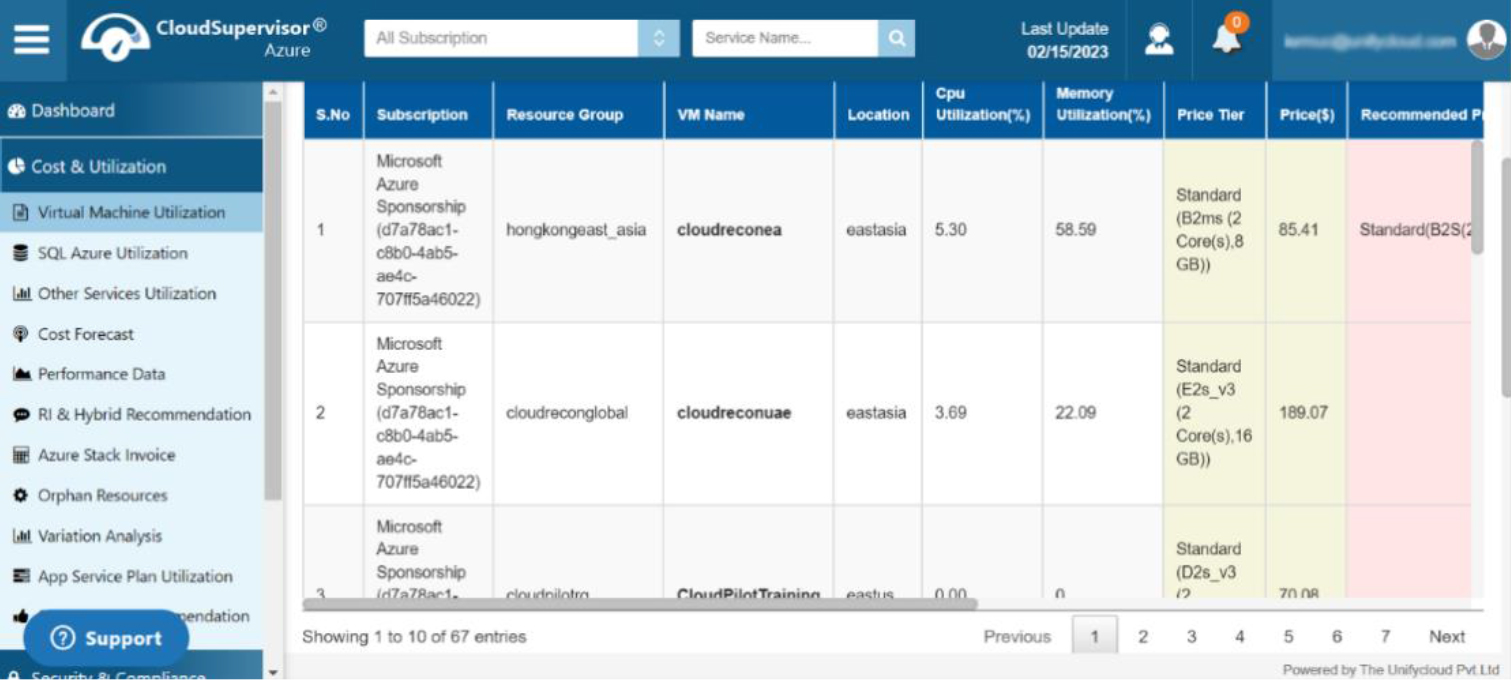
1. Virtual Machine Utilization
-
This dashboard displays the consumption of virtual machines by various services, including average, minimum, and maximum utilisation. It also delivers useful recommendations based on per-hour utilization assessments.
-
Click on the view icon in the required subscription grid that would provide you the utilization trend of every single day.
-
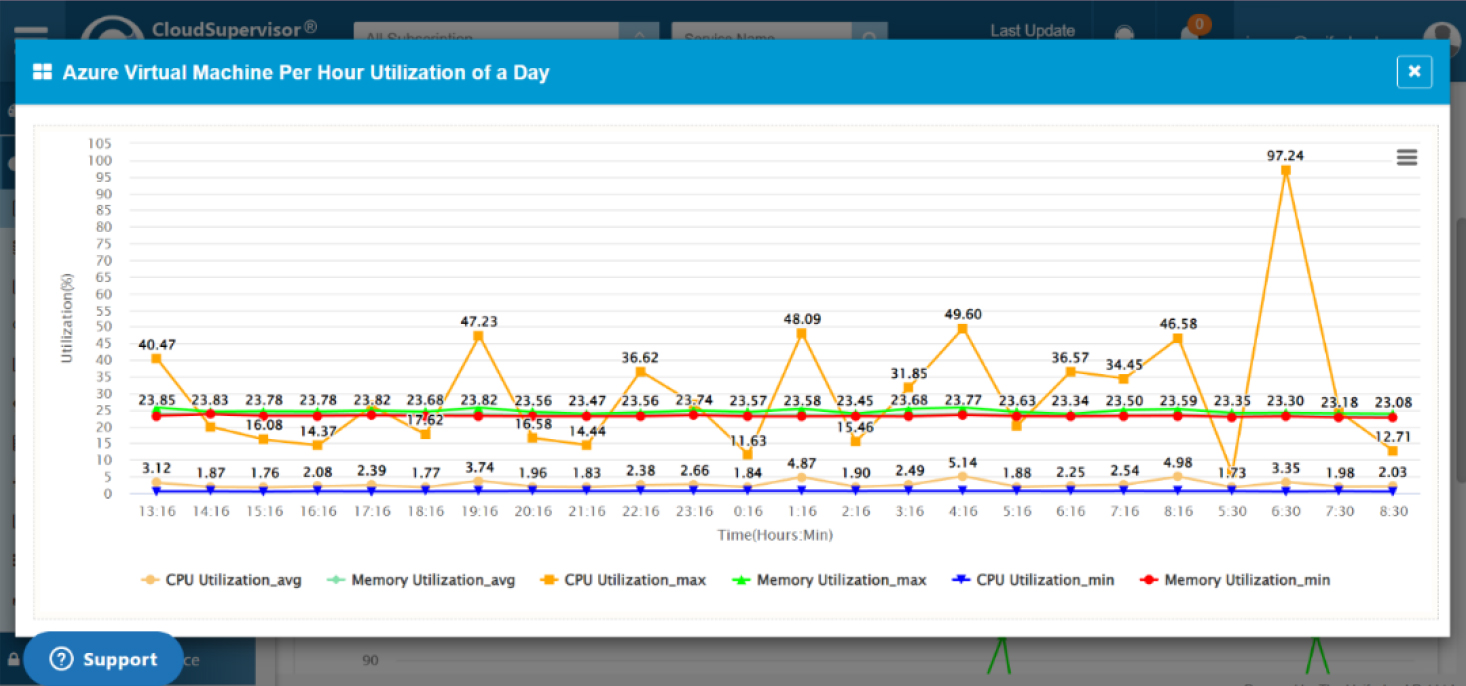
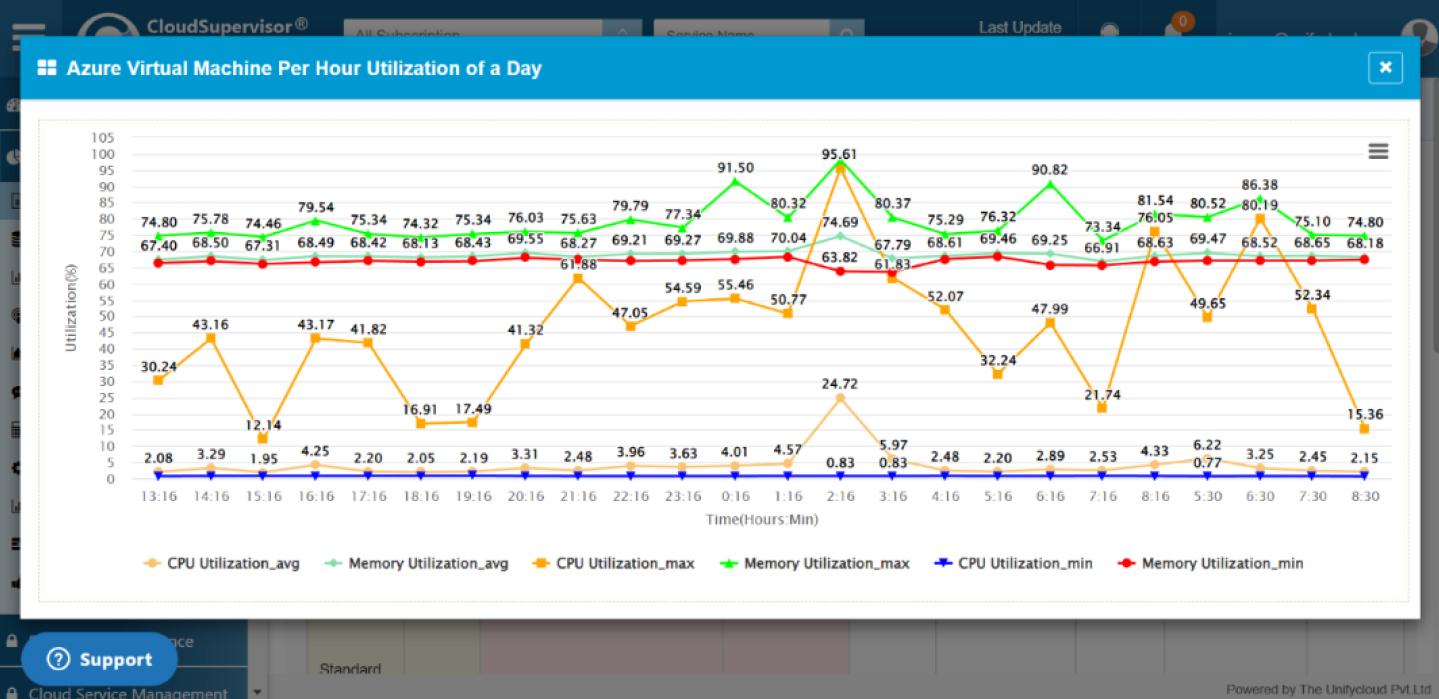
This dashboard provides the exact per hour utilization of Azure virtual machines.
-
-
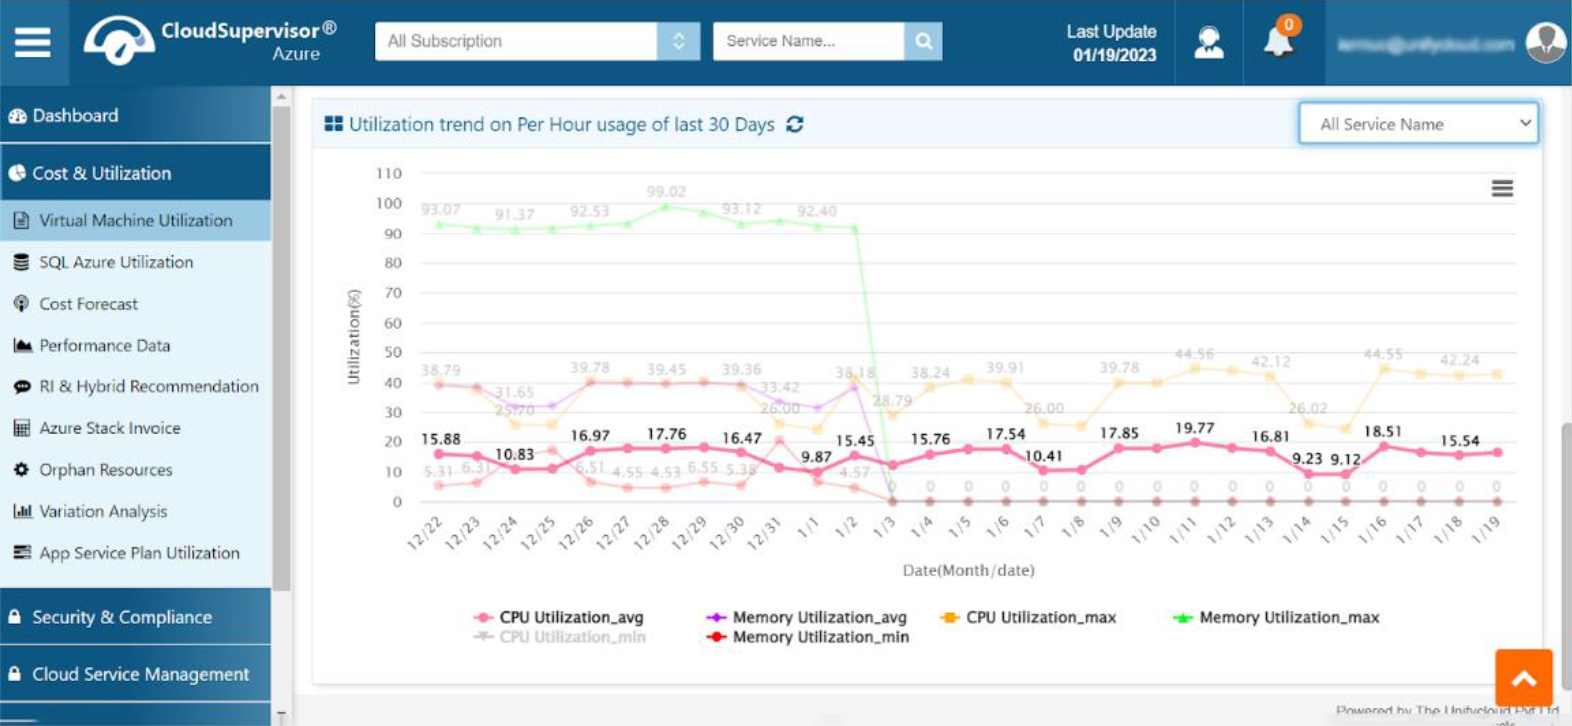
2. Utilisation trend on Per Hour usage of last 30 Days
This dashboard displays the CPU and memory consumption of several services over the last 30 days, with a per hour refresh rate. It provides precise statistics on the CPU utilisation average, minimum and maximum of various subscriptions. It also provides detailed information on the Memory utilisation max and min values, as well as the Memory utilisation average values.

-
2.1 CPU Utilization Avg
When you click on the CPU Utilization Avg, you will be directed to the CPU Utilization trend of several services on the specified dates.
-
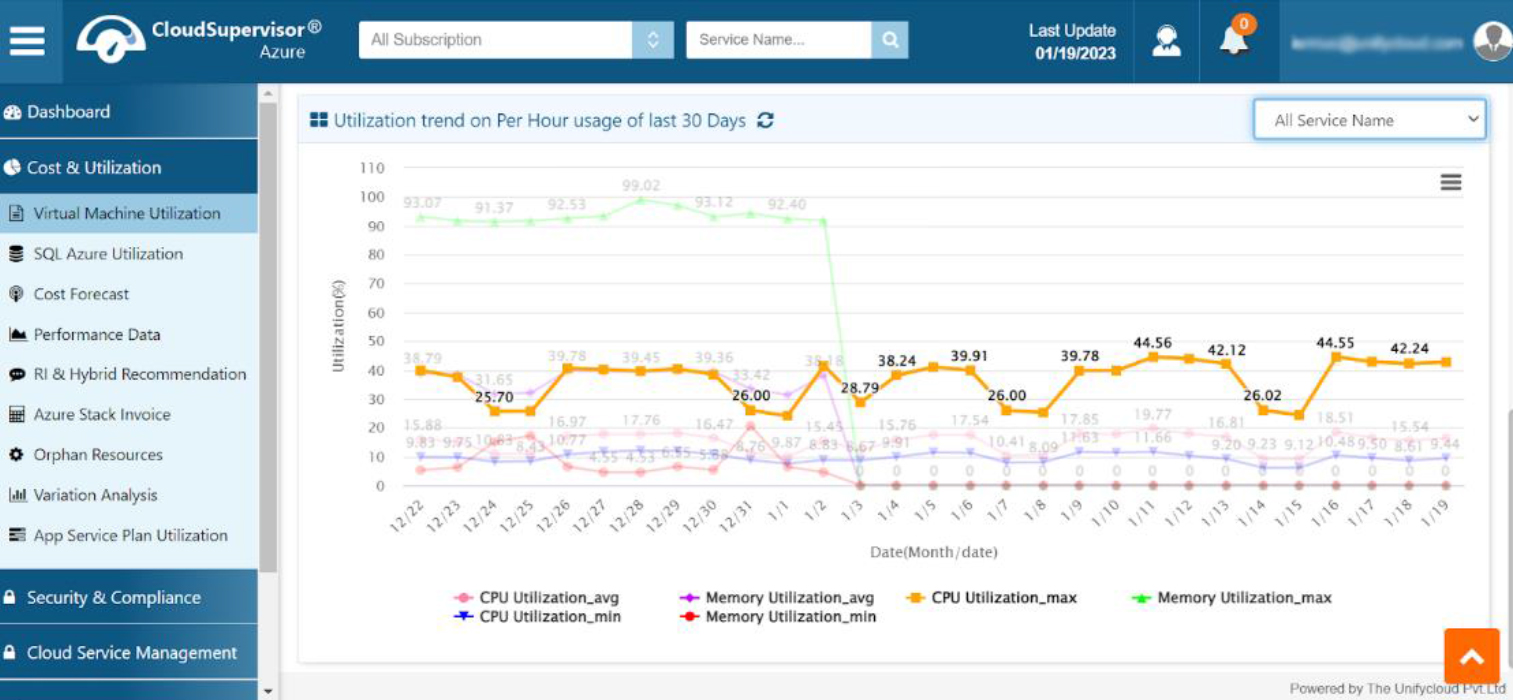
2.2 CPU Utilization Max
When you click the button, you will be redirected to a graph displaying the maximum CPU consumption of various services on the respective days.
-
2.3 CPU Utilization Min
Click on the icon , it will provide the minimum CPU utilization of various services.

-
2.4 Memory Utilization Avg
Clicking the Memory Utilization Avg icon will display an accurate graph of the average memory utilised by each service. It also includes the percentage of utilisation and the date.

-
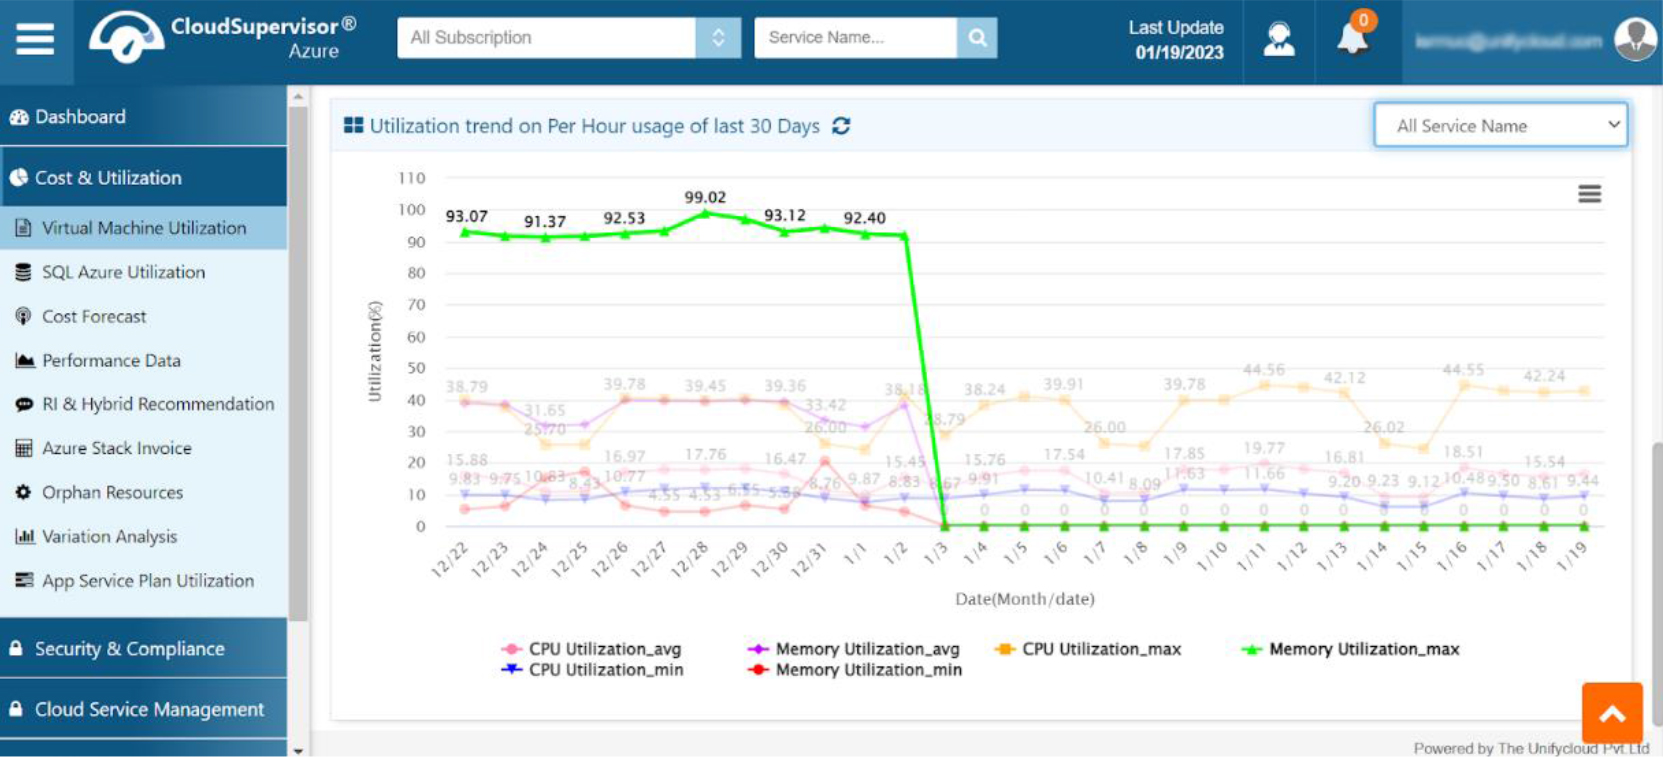
2.5 Memory Utilization Max
When the icon is clicked, a graph displaying the maximum memory use for each service is displayed.
-
2.6 Memory Utilization Min
Click on the Memory utilization_min icon, It will redirect you to the details of minimal memory utilization of various services.

-
2.1 CPU Utilization Avg
-
3. Saving Plan Recommendations
-
This dashboard provides in depth information of the cost consumption PAG, Savings plan, the tenure, savings amount and the committed amount of each and every subscription.
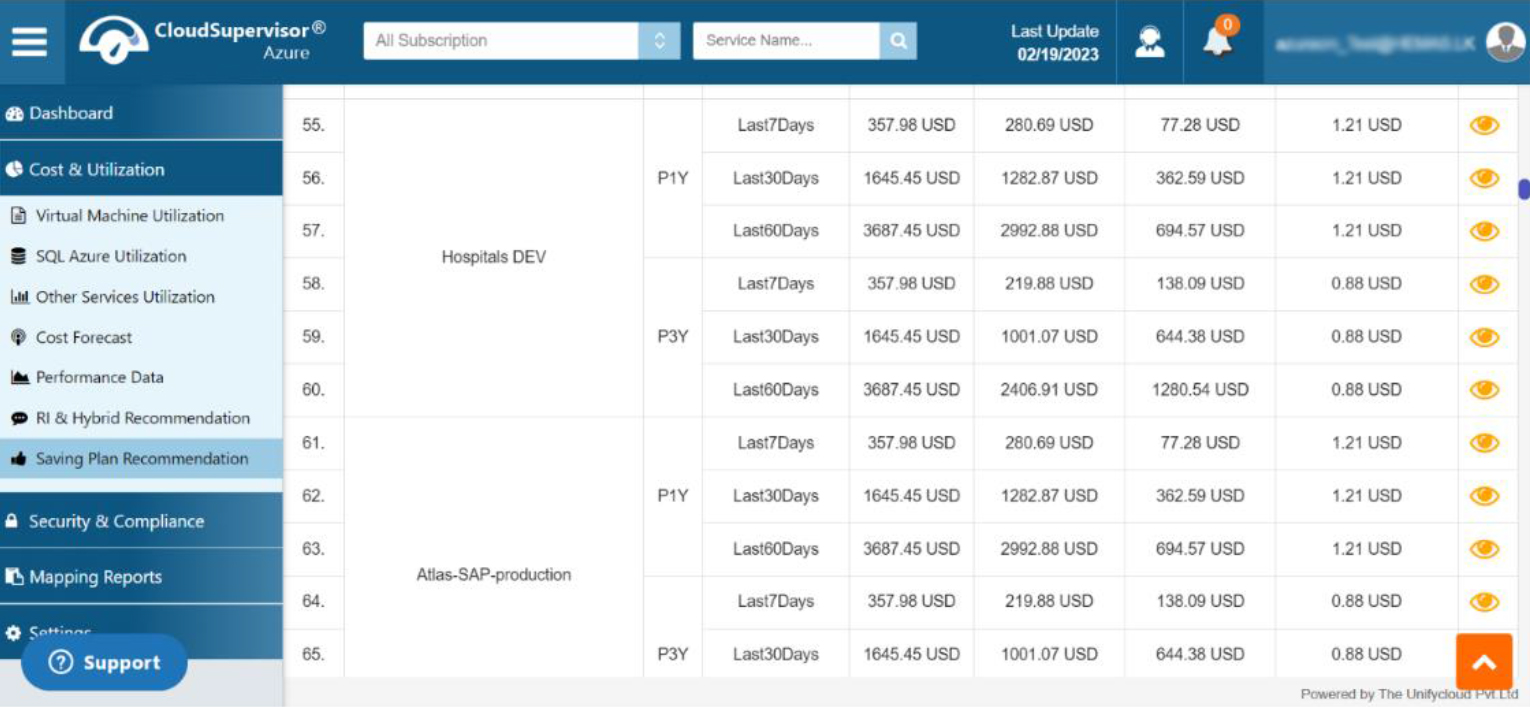
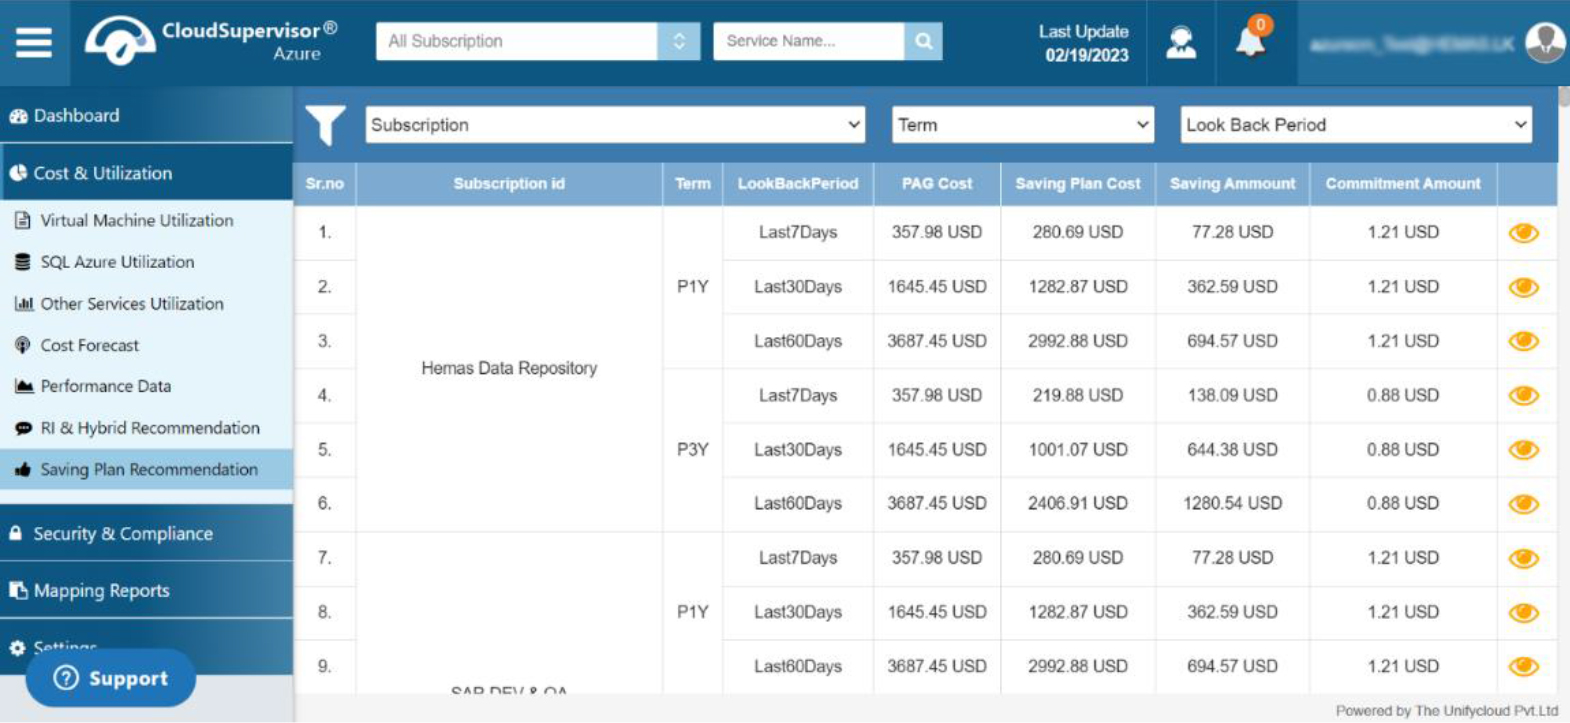
Click on the eye icon , it will redirect you towards the recommendation list based on your usage of last 7 days
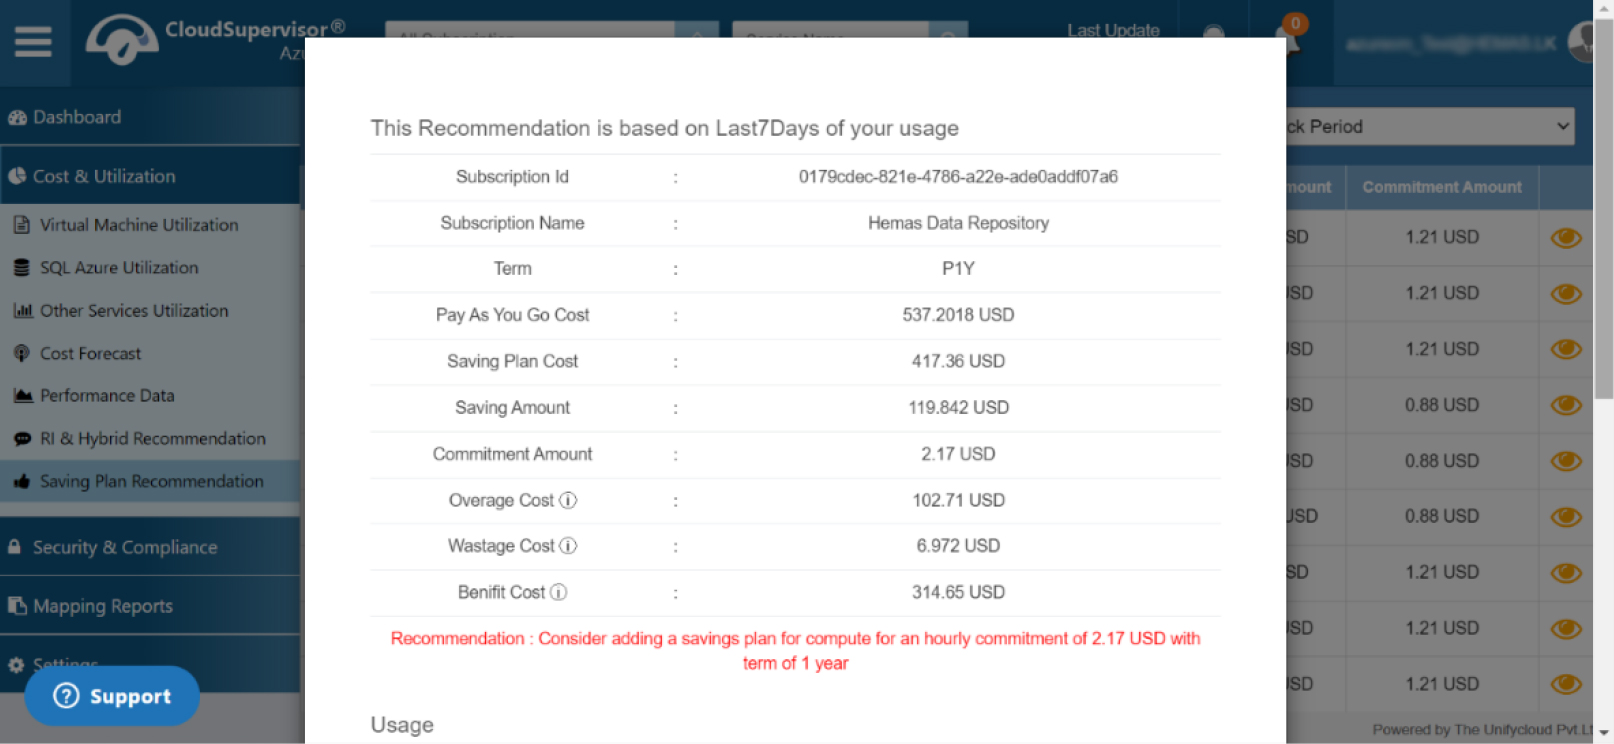
This dashboard provides relevant suggestions based on last 7 days of your usage. It provides the cost information for the savings plan, pay As You Go, overage, wastage, and benefit.
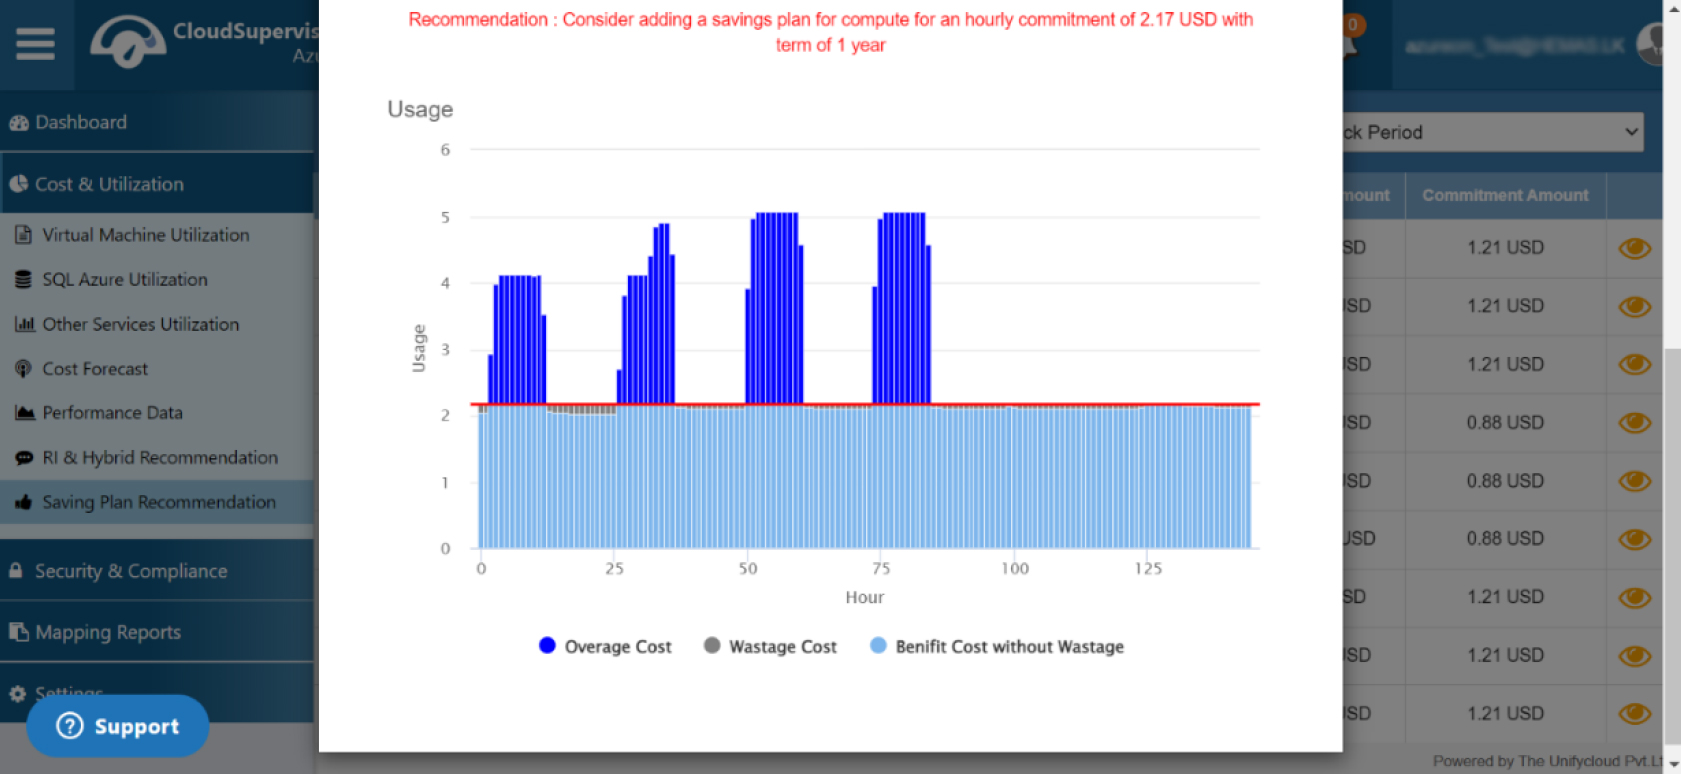
It also provides recommendation considering hourly commitment of 2.17 USD within a tenure of one year.
-
-
4. Mapping Reports
-
4.1 Tag Mapping
This dashboard offers the selection of Supervisor Tag Keys, you can select from the drop down list of tag keys.
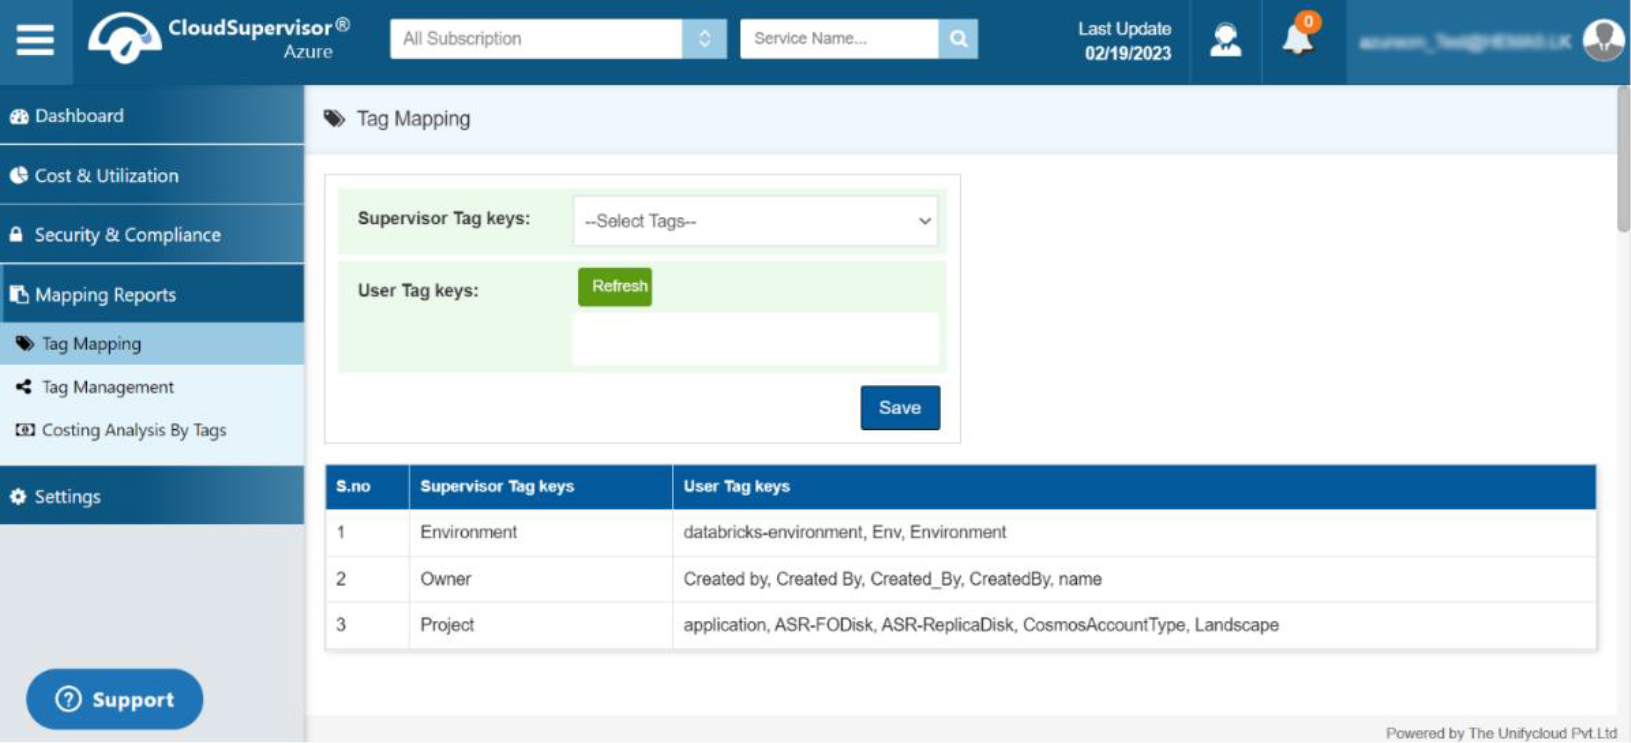
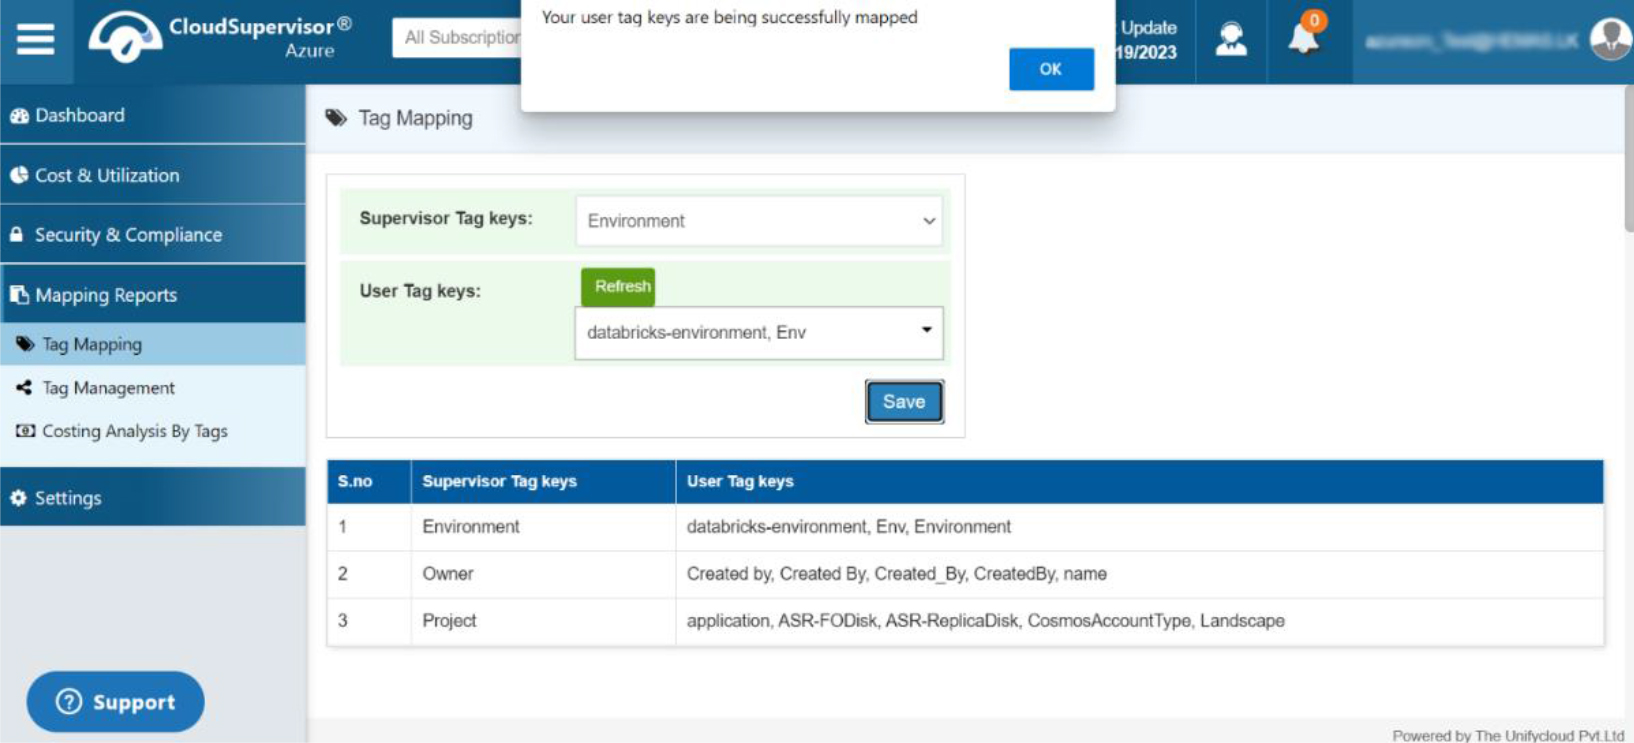
You can map the supervisor tag keys and customers can save the mapping.
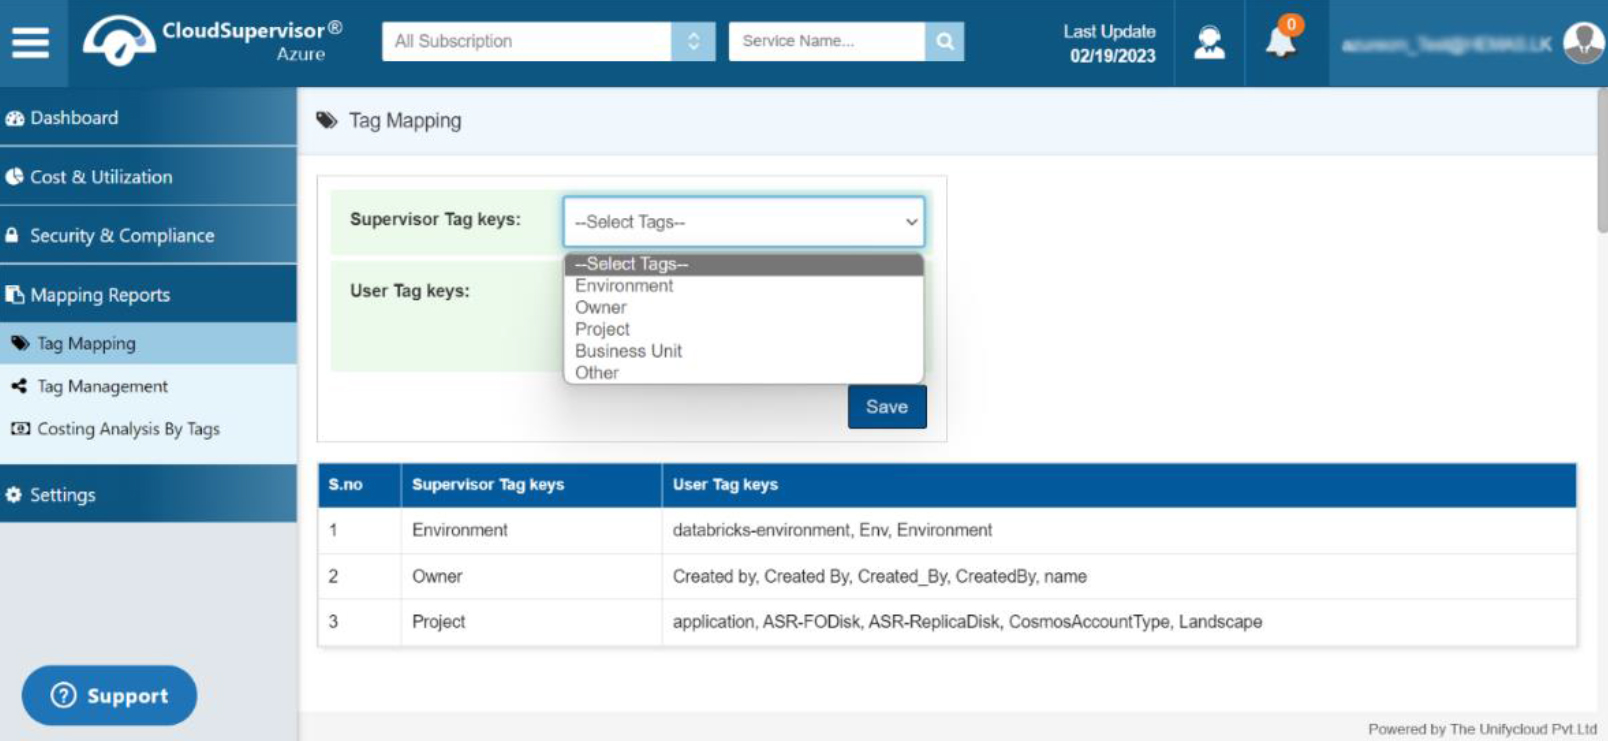
The user tag keys will be mapped successfully with the supervisor tag keys.
This Dashboard is for mapping the supervisor tag keys with the user tag keys.
-
4.1 Tag Mapping
-
5. Tag Management
-
5.1 Import/Export template
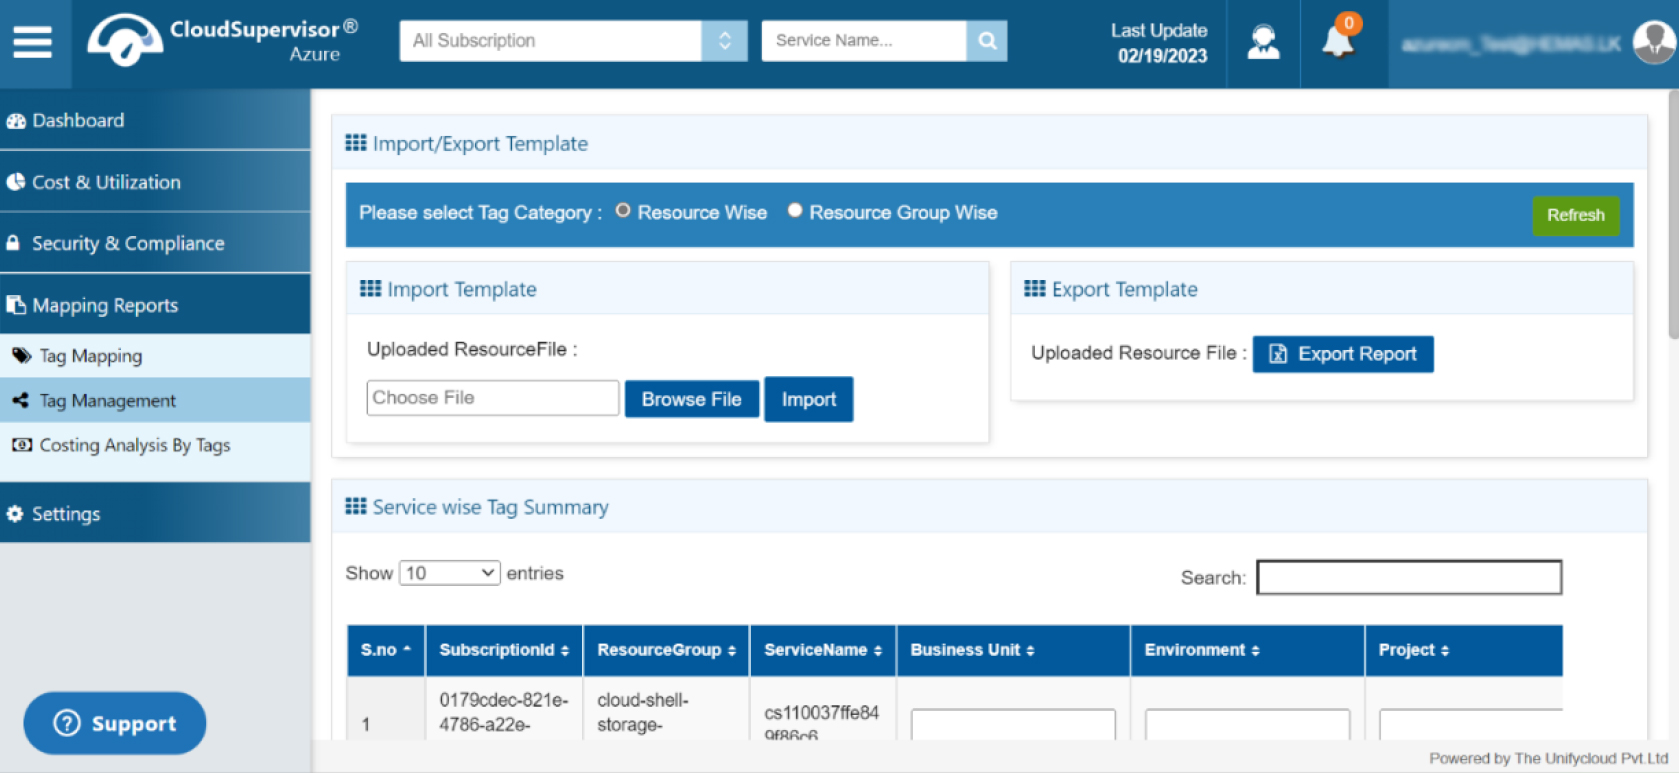
You can select the tag category from the two variants such as Resource wise and Resource group wise. This provides import and export feature to upload resource file
-
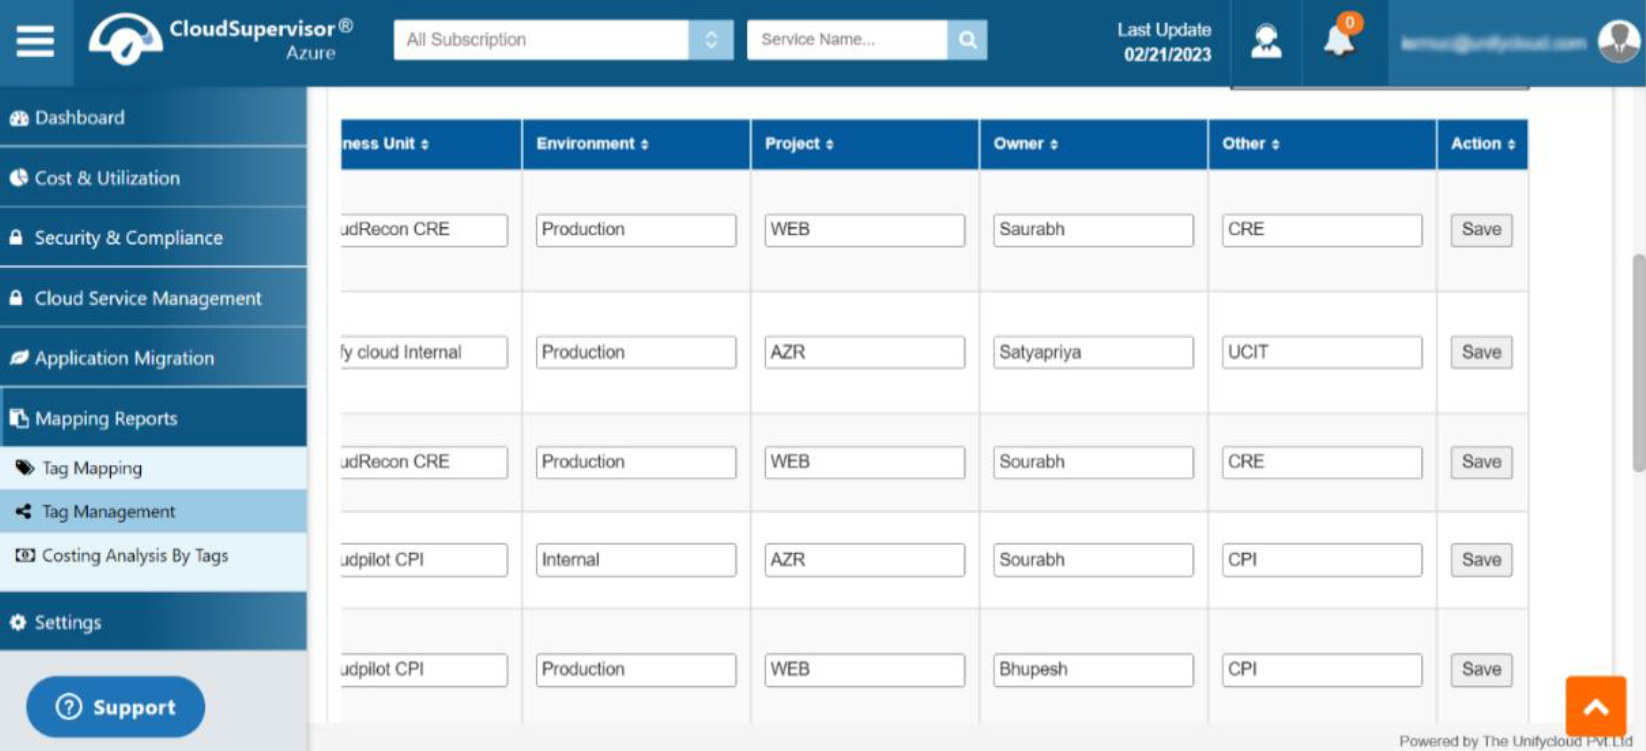
5.2 Service wise Tag Summary
This provides the subscription details along with resource group, subscription ID, Service name, project,environment and business unit. It also provides an option to save the action.
-
5.1 Import/Export template
-
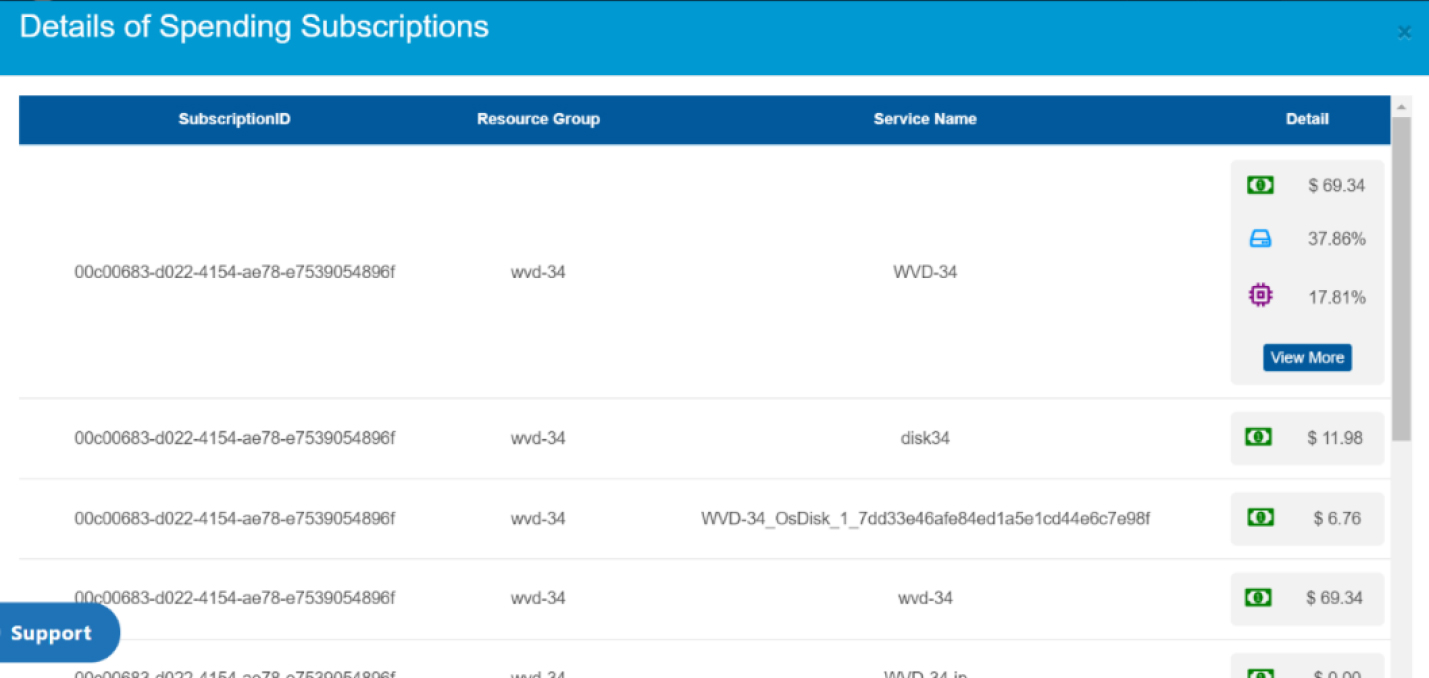
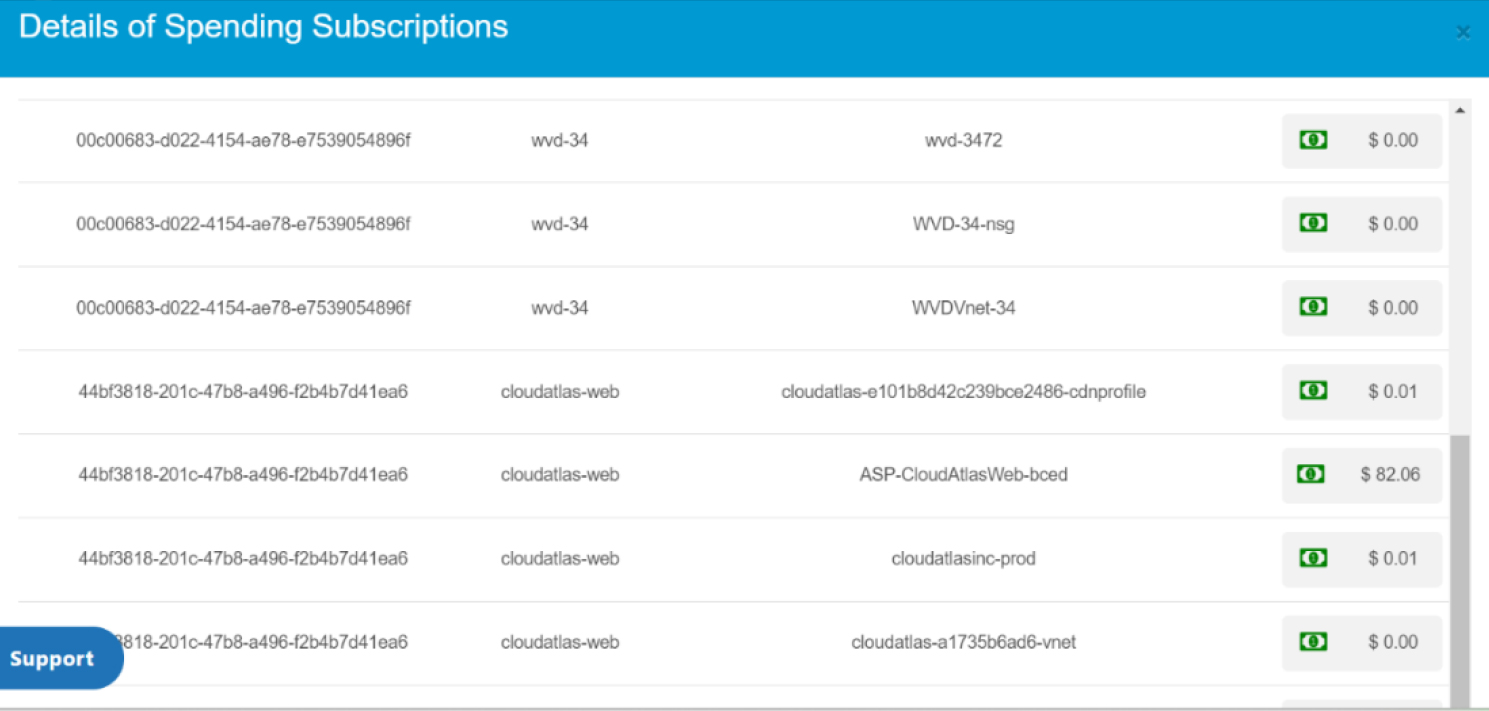
6. Costing Analysis by Tags
This dashboard provides the costing recommendations based on tags such as Business unit,Environment, project, owner, other.
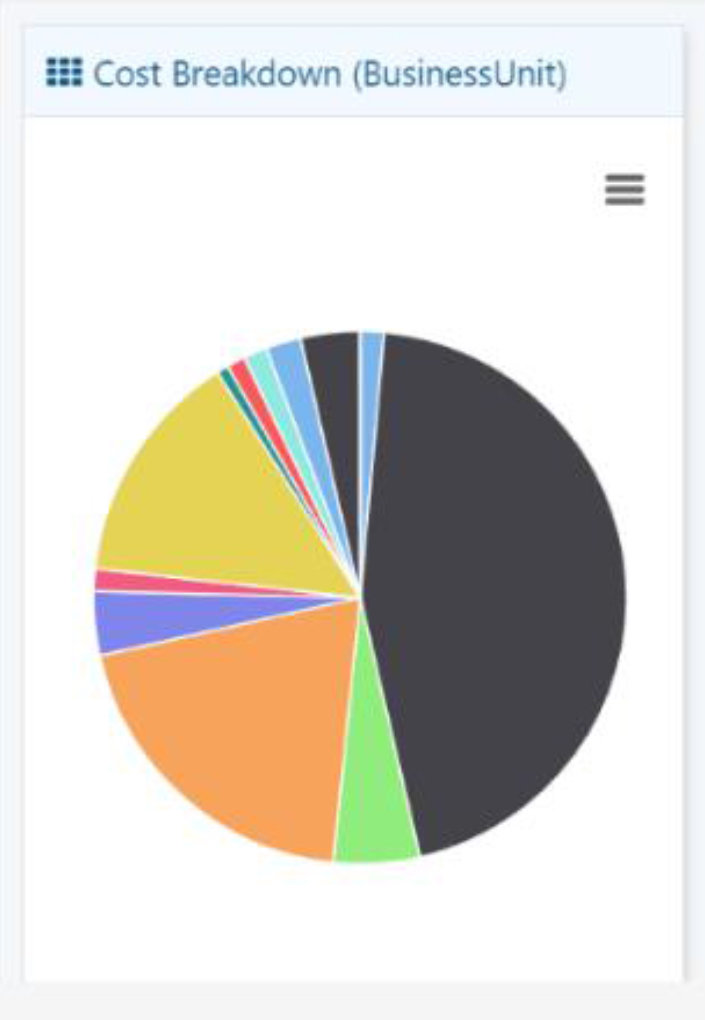
Click on any of the tags such as Business, Environment, Project, Owner and other, which will direct you to the pie chart with cost break down. It will also offer the details of subscription wise spending.
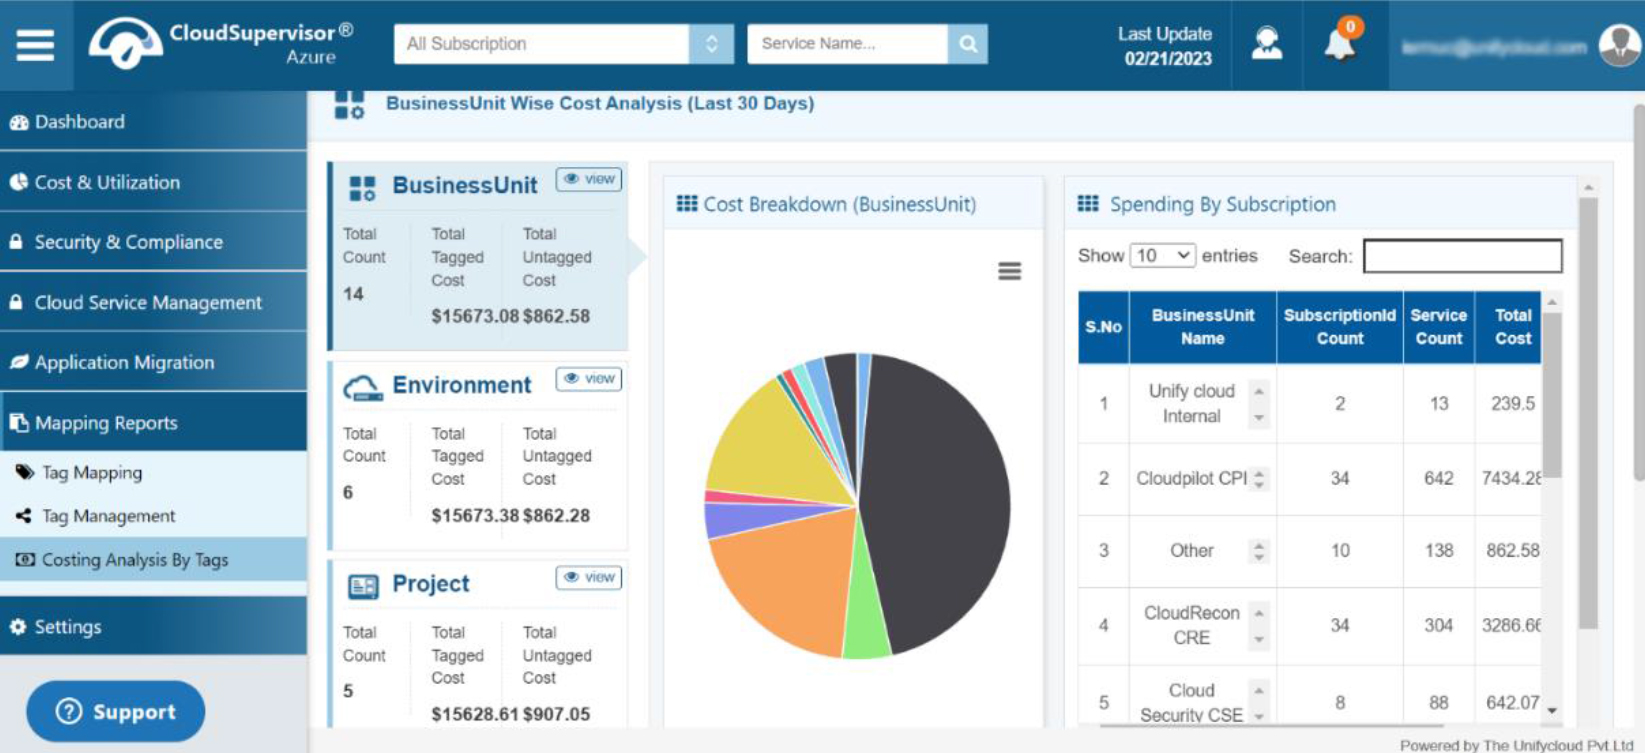
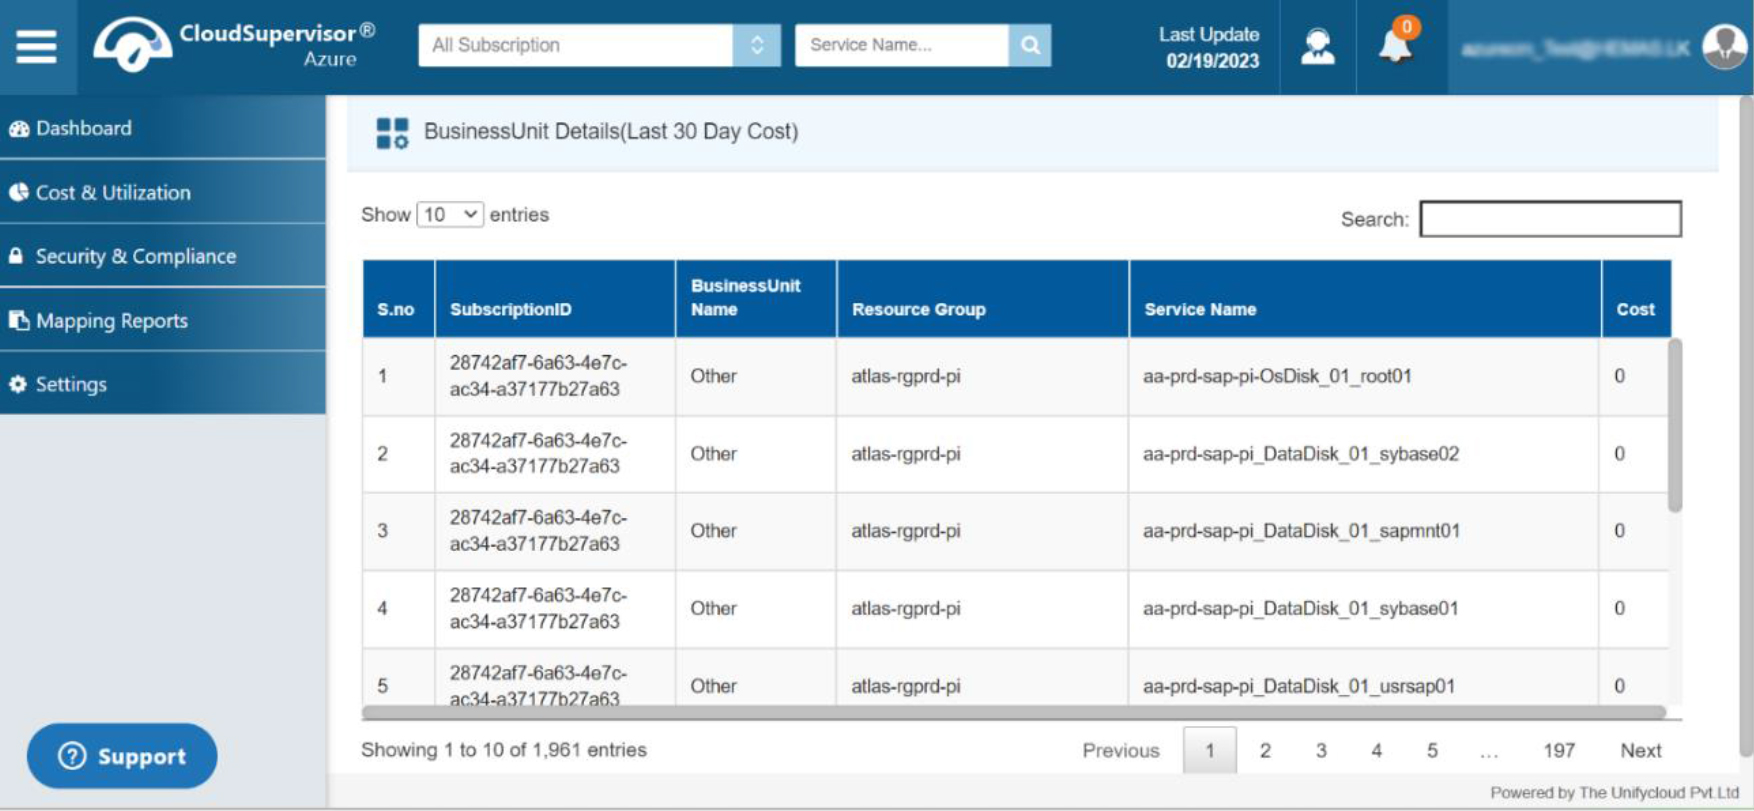
Click on the view Icon, it will redirect you towards the business unit details dashboard. This provides the cost utilization of last 30 days.
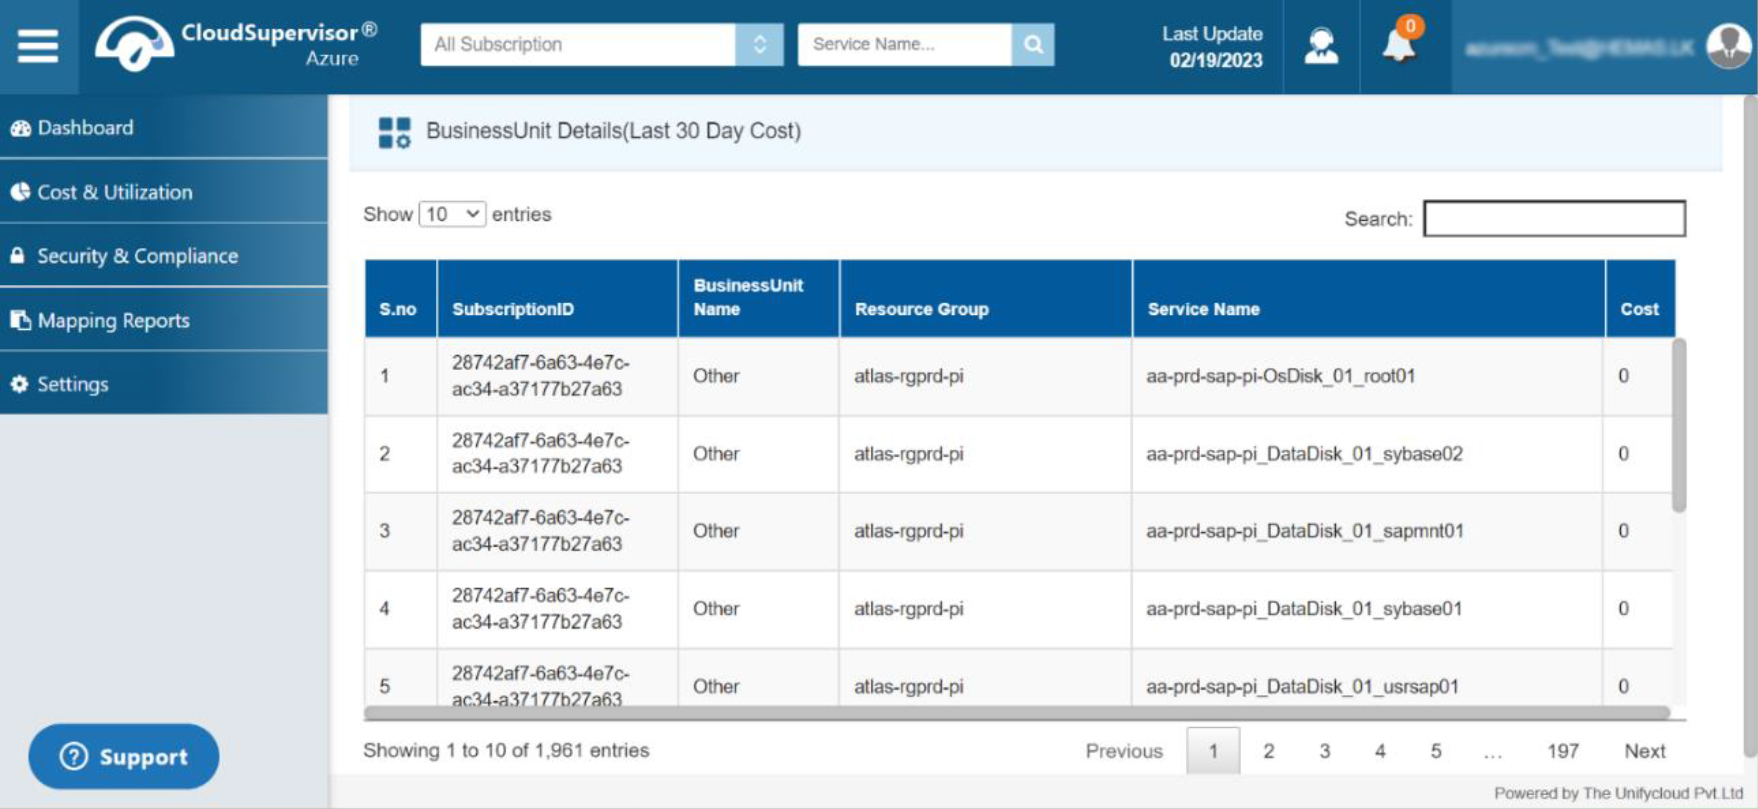
Click on the business unit which will redirect you to the dashboard that provides the price breakdown of our products such as CloudRecon, CloudPilot , Cloudsupervisor and others.
It will also direct you to the spending by subscription list, which provides the details of Business unit Name, Subscription Id count, service count and total cost.
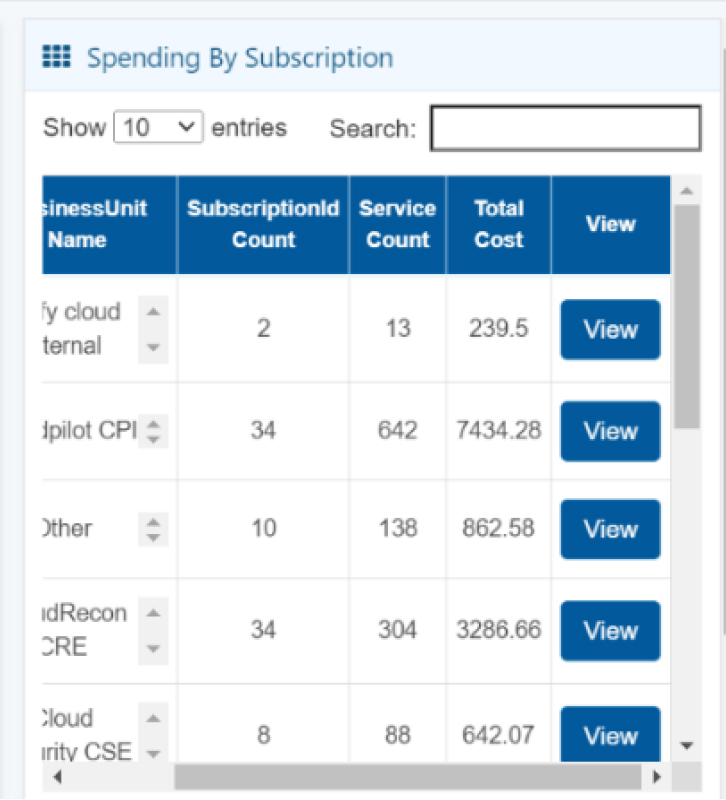
Click on the View icon, which redirects to the dashboard that offers the details of subscription wise spending.
Click on the view Icon, it will redirect you towards the business unit details dashboard. This provides the cost utilization of last 30 days.
-
1. Virtual Machine Utilization